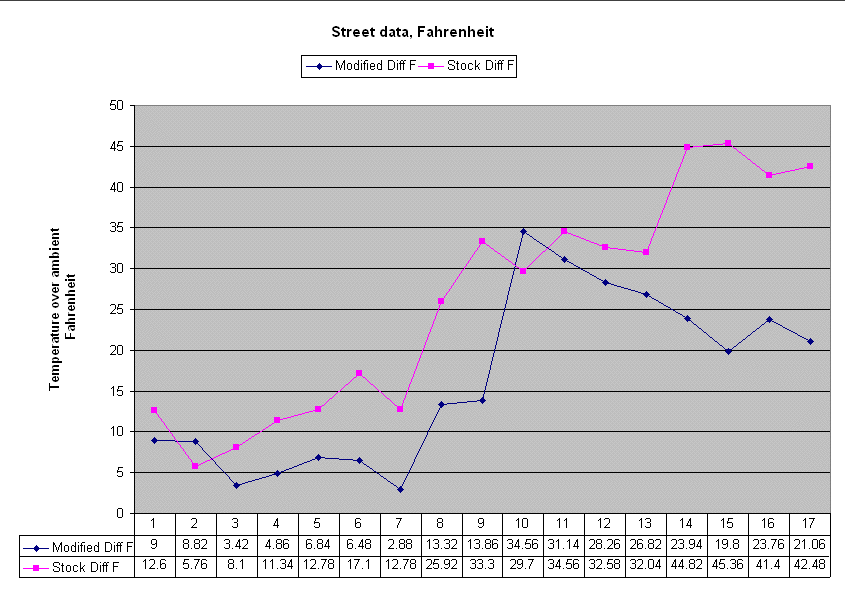
Intake Temperature Logging, Afternoon Runs
Background data:
Combined city and highway driving started at approx 2PM and lasting approx 45 minutes.
The first plot was taken immediately after startup. The next 5 plots are highway travel. The remaining plots (starting with plot 7) are city travel in moderate to heavy rush-hour congestion. The same path was taken for each run. No attempt was made to take data at the same places of travel due to the heavy traffic encountered at these times.
Readings were taken at notable points during travel, always after a certain state had been maintained for at least one minute. Example: A reading may have been taken after sustaining 50 MPH for one minute or at a stop light after sitting at least one minute. If an activity took more than a few minutes, such as sustained highway speeds, multiple plots may exist to span that action.

Interpretation:
The spike at plot 10 for the modified intake corresponds to a 15 minute stop at a store, allowing the intake to heat soak while stopped. The spike at plot 14 for the stock intake corresponds to a stop light that took three cycles to get through. No other lights had such a duration.
In general this chart reflects a complete success for the custom intake. In this chart the modified intake showed clear advantages over the stock intake. Even after allowed to heat soak in a parking lot for 15 minutes it quickly regained its composure and started to normalize the intake temperature. By the end of the 45 minute trip the difference between stock and custom was nearly 25 degrees! It's hard to say how high the stock intake might have gone if I had driven further while the modified intake was still going DOWN. If not for the stop at the store the graph would have been even more dramatic.
Copyleft Mark Leinhos
Last modified 08/04/15
|


